![[ANSYS, Inc. Logo]](fluentlogo.gif)


|
|
|
You can also generate a plot of circumferential averages in ANSYS FLUENT. This allows you to find the average value of a quantity at several different radial or axial positions in your model. ANSYS FLUENT computes the average of the quantity over a specified circumferential area, and then plots the average against the radial or axial coordinate.
Steps for Generating an XY Plot of Circumferential Averages
You can generate an XY plot of circumferential averages in the radial direction using the circum-avg-radial text command:
plot
 circum-avg-radial
or you can use the circum-avg-axial text command to generate an average in the axial direction:
plot
 circum-avg-axial
The steps for generating an XY plot of circumferential averages are as follows:
|
|
Use the
Mesh Display dialog box to see a list of surfaces on which you can plot data. (Pressing
<Enter> will not show a list of available surfaces.)
|
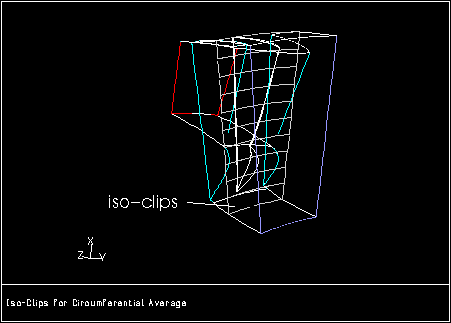
ANSYS FLUENT will create circumferential bands by isoclipping the specified surface into equal bands of radial or axial coordinate. An example of the iso-clips created is shown in Figure 29.9.10. (The radial or axial coordinate is derived from the rotation axis of the Reference Zone specified in the Reference Values task page.)
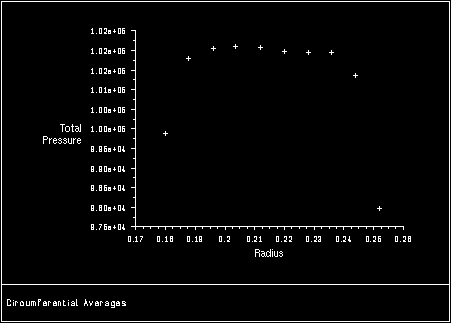
ANSYS FLUENT then computes the average of the variable for each band using the area-weighted average described in this section in the separate Theory Guide. Finally, it plots the average of the variable as a function of radial or axial coordinate. Figure 29.9.11 shows an example of an XY plot of circumferential averages using radial coordinates.
When the circumferential average plot is generated, ANSYS FLUENT also creates a new surface called radial-bands or axial-bands, which contains the iso-clips described above (see Figure 29.9.10). You can use this surface to generate other XY plots. For more information on the creation and manipulation of surfaces, see Chapter 28.
Customizing the Appearance of the Plot
If you want to customize the appearance of the axes or curves in a circumferential average plot, you can save the plot data to a file (using the plot-to-file text command, as described below), read the file into ANSYS FLUENT and plot it again (using the File XY Plot dialog box, as described in Section 29.9.3), and then use the Axes and Curves dialog box (as described in Sections 29.9.9 and 29.9.10) to modify the appearance of the plot.
To save the plot data to a file, first use the plot-to-file text command to specify the name of the file.
plot
 file-set
 plot-to-file
Then generate the circumferential average XY plot as described above. ANSYS FLUENT will display the plot in the graphics window, and also save the plot data to the specified file.
Previous:
29.9.4 XY Plots of