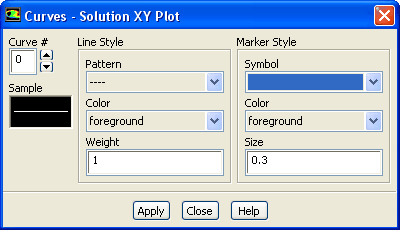
The
Curves dialog box allows you to modify the appearance of the lines and markers used in XY plots. Note that the title following
Curves in the dialog box indicates which plot environment you are changing. You can set different parameters for each type of plot that
ANSYS FLUENT can generate. See Section
29.9.10 for details about the items below.
Controls
Curve #
defines the active curve number. The present and future marker and line styles apply to the defined curve number. The curves are numbered sequentially, starting from 0. For example, if you were plotting flow-field values on two zones, the first zone would be curve 0, and the second, curve 1. If the plot contains only one curve, the
Curve # is set to 0 and is not editable.
Sample
displays a single marker and line with the current style attributes.
Line Style
contains controls for modifying the appearance of the active curve.
Pattern
sets the pattern of the active curve. A drop-down list allows you to set the line pattern. Except for
center and
phantom lines, the list displays examples of the pattern choices. A
center line alternates a very long dash and a short dash and a
phantom line alternates a very long dash and a double short dash.
Color
sets the color of the active curve. A drop-down list allows you to select from a list of color names.
Weight
sets the thickness of the active curve. A line weight of 1.0 is normally 1 pixel wide. Therefore, a weight of 2.0 would make the line twice as thick (i.e., 2 pixels wide).
Marker Style
contains controls for modifying the appearance of the active curve's marker.
Symbol
sets the symbol used to mark data. You can select the symbol from a drop-down list that contains all the symbol choices. The
Sample box will allow you to experiment with various markers. For example, in plotting pressure-coefficient data on the upper and lower surfaces of an airfoil, the symbol
/*\ (filled-in upward-pointing triangle) could be used for the marker representing the upper surface data, and the symbol
\*/ (filled-in downward-pointing triangle) could be used for the marker representing the lower surface data.
Color
sets the color of the marker on the active line number. A drop-down list allows you to select from a list of color names.
Size
sets the size of the data marker. A symbol of size 1.0 is 3.0% of the height of the display screen, except for the ".'' symbol, which is always one pixel.
![[ANSYS, Inc. Logo]](fluentlogo.gif)