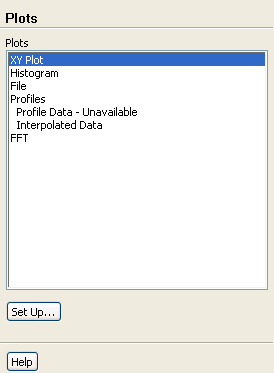
The
Plots task page allows you to create plots (XY, histograms, profiles, etc.) of your computational results. See Chapter
29 for more information.
Controls
-
Plots
contains a listing of the various plot types available in
ANSYS FLUENT.
You can double-click an item in the
Plots list to open the corresponding dialog box, or you can select the item in the list and click the
Set Up... button.
-
XY Plot
- selecting this item and clicking the
Set Up... button opens the
Solution XY Plot dialog box.
-
Histogram
- selecting this item and clicking the
Set Up... button opens the
Histogram dialog box.
-
File
- selecting this item and clicking the
Set Up... button opens the
File XY Plot dialog box.
-
Profiles
two types of profile plots are available:
-
Profile Data
- selecting this item and clicking the
Set Up... button opens the
Plot Profile Data dialog box.
-
Interpolated Data
- selecting this item and clicking the
Set Up... button opens the
Plot Interpolated Data dialog box
-
FFT
- selecting this item and clicking the
Set Up... button opens the
Fourier Transform dialog box.
-
Set Up...
displays the dialog box corresponding to the selected item in the
Plots list.


 Previous:
33.19.32 Annotate Dialog Box
Previous:
33.19.32 Annotate Dialog Box
Up:
33. Task Page Reference
Next:
33.20.1 Solution XY Plot
Release 12.0 © ANSYS, Inc. 2009-01-29 ![[ANSYS, Inc. Logo]](fluentlogo.gif)