The
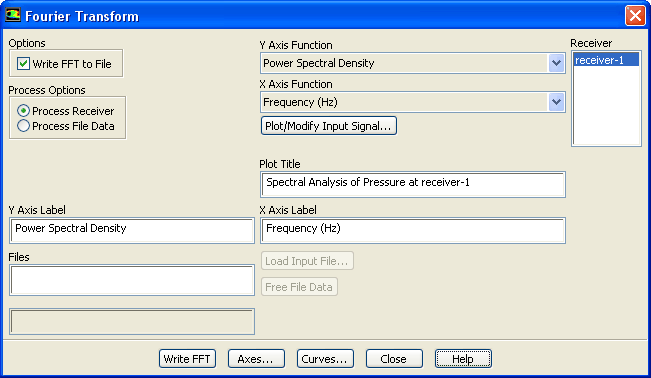
Fourier Transform dialog box allows you to analyze your time dependent data using the Fast Fourier Transform (FFT) algorithm. See Section
29.11 for details about the items below.
Controls
Options
lets you write the FFT data to a file or display the FFT data in a graphics window.
Write FFT to File
allows you to write out the FFT data directly to a file. When selected, the
Plot FFT... buttons becomes the
Write FFT... button.
Process Options
contains options to analyze signal data.
Process Receiver
allows you to analyze receiver data stored in memory.
Process File Data
allows you to analyze signal data from an existing input file.
Y Axis Function
contains a list from which you can select the function for the
axis.
X Axis Function
contains a list from which you can select the function for the
axis.
Receiver
contains a list of receivers from which you can select when the
Process Receiver option is enabled.
Plot Title
lets you create a new title or edit the original title for the FFT plot. By default,
ANSYS FLUENT adds the string "Spectral Analysis of'' to the title originally applied to the input signal plot.
Y-axis Label
allows you to create a new
axis label or edit the original
axis label. By default, the
Y-axis Label corresponds to the selection in the
Y Axis Function drop-down list.
X-axis Label
allows you to create a new
axis label or edit the original
axis label. By default, the
X-axis Label corresponds to the selection in the
X Axis Function drop-down list.
Files
lists the loaded input signal data files.
Load Input File...
loads an input signal data file into
ANSYS FLUENT for FFT analysis. The input file is listed under
Files.
Free File Data
removes data from FFT analysis once the input signal data file is selected in the
Files list.
Plot FFT
displays the FFT data in a graphic window. If the
Write FFT to File option is selected, then this button becomes the
Write FFT button, which opens a file selection dialog box so that you write the FFT data to a file.
Write FFT
opens the
Select File dialog box (see Section
2.1.6) in which you can specify a name and save the FFT data to a file. If the
Write FFT to File option is selected, then the
Plot FFT button changes to the
Write FFT button.
Axes...
opens the
Axes dialog box, which allows you to customize the plot axes.
Curves...
opens the
Curves dialog box, which allows you to customize the curves used in the plot.
![[ANSYS, Inc. Logo]](fluentlogo.gif)


 axis.
axis.
 axis.
axis.
 axis label or edit the original
 axis label. By default, the
Y-axis Label corresponds to the selection in the
Y Axis Function drop-down list.
axis label. By default, the
Y-axis Label corresponds to the selection in the
Y Axis Function drop-down list.
 axis label or edit the original
 axis label. By default, the
X-axis Label corresponds to the selection in the
X Axis Function drop-down list.
axis label. By default, the
X-axis Label corresponds to the selection in the
X Axis Function drop-down list.