The
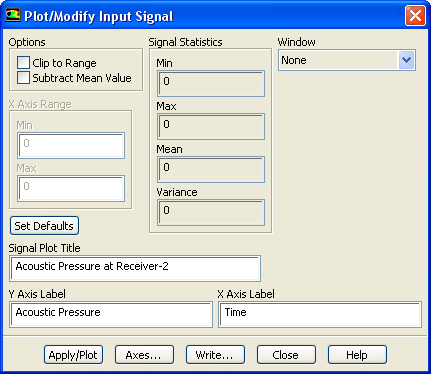
Plot/Modify Input Signal dialog box allows you to customize the input signal data set. It is opened from the
Fourier Transform dialog box. See Section
29.11.4 for details about the items below.
Controls
Options
allows you to process some or all of the input signal data.
Clip to Range
allows you to analyze a portion of the input signal by specifying data range.
Subtract Mean Value
reduces y axis quantities by the mean value of the relevant signal property.
Signal Statistics
displays signal information.
Min
displays the minimum value for the input signal.
Max
displays the maximum value for the input signal.
Mean
displays the average value for the input signal.
Variance
displays the variance for the input signal.
X Axis Range
allows for a portion of the input signal to be analyzed when the
Process the whole data option is turned off.
Min
specifies a minimum value for the
axis.
Max
specifies a maximum value for the
axis.
Set Defaults
resets the
axis minimum and maximum values to their original value and turns on the
Process the whole data option.
Signal Plot Title
lets you create a new title or edit the original title for the input signal plot. By default, the
Signal Plot Title corresponds with the title originally applied to the input signal plot.
Y Axis Label
allows you to create a new
axis label or edit the original
axis label. By default, the
Y-axis Label corresponds with the
axis label originally applied to the input signal plot.
X Axis Label
allows you to create a new
axis label or edit the original
axis label. By default, the
X-axis Label corresponds with the
axis label originally applied to the input signal plot.
Window
lets you specify a windowing technique to remove discontinuities in the FFT calculation.
None
applies no windowing technique. This is the default setting.
Hamming
applies the Hamming technique.
Hanning
applies the Hanning technique.
Barlett
applies the Barlett technique.
Blackman
applies the Blackman technique.
Apply/Plot
applies any changes you have made in the dialog box and displays the input signal data in a graphics window.
Axes...
opens the
Axes dialog box, which allows you to customize the plot axes.
Write...
opens the
Select File dialog box (see Section
2.1.6), in which you can save the signals to a file.
![[ANSYS, Inc. Logo]](fluentlogo.gif)


 axis.
axis.
 axis.
axis.
 axis minimum and maximum values to their original value and turns on the
Process the whole data option.
axis minimum and maximum values to their original value and turns on the
Process the whole data option.
 axis label or edit the original
 axis label. By default, the
Y-axis Label corresponds with the
axis label. By default, the
Y-axis Label corresponds with the
 axis label originally applied to the input signal plot.
 axis label or edit the original
 axis label. By default, the
X-axis Label corresponds with the
axis label. By default, the
X-axis Label corresponds with the
 axis label originally applied to the input signal plot.