![[ANSYS, Inc. Logo]](fluentlogo.gif)


|
|
|
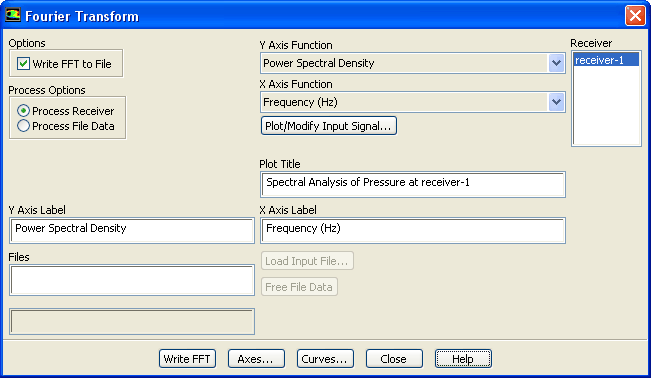
The ANSYS FLUENT FFT utility is available through the Fourier Transform dialog box (Figure 29.11.1).
 Plots
Plots

 FFT
FFT
 Set Up...
Loading Data for Spectral Analysis
FFT analysis requires an input signal data file consisting of time-sequence data. To load an input signal data file into the Fourier Transform dialog box, click the Load Input File... button. This displays a File Selection dialog box where you can browse through your file directories and locate your data file containing your time-sequence data. To remove a file from the Files list, select it and then click the Free File Data button.
If you computed acoustic signals "on the fly'', you have the option of processing signal data from a file or processing receiver data stored in memory. To analyze signal data from an existing input file, select Process File Data under Process Options and proceed as described above. To analyze receiver data stored in memory, select Process Receiver under Process Options and select the appropriate receiver in the Receiver list.
Click Plot FFT to display the spectral analysis data.
Customizing the Input
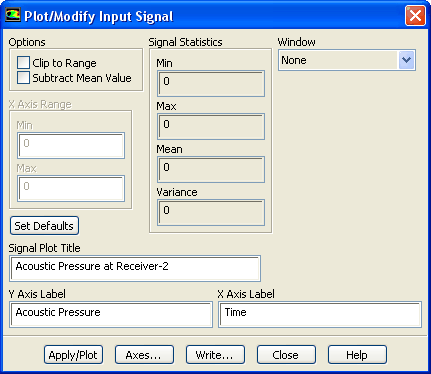
With the input signal data file loaded into the Fourier Transform dialog box, you may want to customize the input signal data set. You can customize the input signal by clicking the Plot/Modify Input Signal button. This displays the Plot/Modify Input Signal dialog box (Figure 29.11.2).
The Plot/Modify Input Signal dialog box allows you to analyze a portion of the input signal, view input Signal Statistics ( Min, Max, Mean, and Variance), and set title and label information for the input signal data file.
Customizing the Input Signal Data Set
By default, the entire data set is analyzed. To analyze a portion of the input signal, turn on the
Clip to Range option and specify the data range by entering
Min and
Max values under
X-Axis Range. To have the
 axis quantities reduced by the
Mean value of the relevant signal property, turn on the
Subtract Mean Value option.
axis quantities reduced by the
Mean value of the relevant signal property, turn on the
Subtract Mean Value option.
The Set Defaults button will reset the original values for the Min and Max fields under X-Axis Range and turn off the Clip to Range option.
Viewing Data Statistics
To aid in the signal analysis, whether for the entire input signal or for a certain range of data, the Signal Statistics portion of the Plot/Modify Input Signal dialog box displays signal information such as minimum, maximum, and average signal values, as well as signal variance.
Customizing Titles and Labels
You can create a new title or edit the original title for the input signal plot by entering a text string in the Signal Plot Title text box. Likewise, you can create a new axis label or edit the original axis label by entering a text string into either the Y-Axis Label text box or the X-Axis Label text box.
Applying the Changes in the Input Signal Data
To apply any changes you have made in the Plot/Modify Input Signal dialog box and view a plot of the input signal, click the Apply/Plot button.
Customizing the Output
In most practical applications with CFD data, you may want to find out how much power or energy is contained in a certain frequency range, but do not want to distinguish positive and negative frequency. In recognition of this, all the outputs from the FFT module in ANSYS FLUENT pertain to one-sided spectra for the range of positive frequency.
The
Fourier Transform (Figure
29.11.1) and
Plot/Modify Input Signal (Figure
29.11.2) dialog boxes allow you to set several different functions for the
 and
and
 axes, apply different FFT windowing techniques, and set various output options.
Specifying a Function for the
 Axis
Axis
You can choose the
 -axis function using the
Y Axis Function drop-down list. Available options for the
-axis function using the
Y Axis Function drop-down list. Available options for the
 -axis functions are as follows:
 ) and is defined as
 |
 |
 |
|
 |
 |
 |
(29.11-9) |
 |
(29.11-10) |
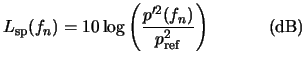
where
 is the power spectral density of the pressure fluctuation and
 is the reference acoustic pressure. See Section
22.2.1 for details about specifying this parameter.
is the reference acoustic pressure. See Section
22.2.1 for details about specifying this parameter.
 |
(29.11-12) |
Further graphical customizations for the
 axis are available by clicking the
Axes... button. For more information, see Section
29.9.9.
axis are available by clicking the
Axes... button. For more information, see Section
29.9.9.
Specifying a Function for the
 Axis
Axis
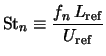
There are three options for the
 -axis function you can choose from. They are all related to the discrete frequencies at which the Fourier coefficients are computed. You can apply specific analytic functions for the
 -axis using the
X Axis Function drop-down list.
-axis using the
X Axis Function drop-down list.
Available options for the
 -axis functions are:
where
 is the number of data points used in the FFT.
 |
(29.11-14) |
where
 and
and
 are the reference length and velocity scales specified in the
Reference Values task page.
are the reference length and velocity scales specified in the
Reference Values task page.
 th or
th or
 th term in the Fourier transform of the signal.
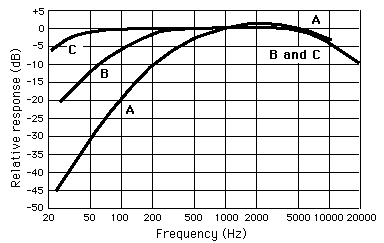
|
Lower
Freq. (Hz) |
Center Freq. (Hz) | Upper Freq. (Hz) | dB A | dB B | dB C |
| 11 | 16 | 22 | -56.7 | -28.5 | -8.5 |
| 22 | 31.5 | 45 | -39.4 | -17.1 | -3.0 |
| 45 | 63 | 90 | -26.2 | -9.3 | -0.8 |
| 90 | 125 | 180 | -16.1 | -4.2 | -0.2 |
| 180 | 250 | 355 | -8.6 | -1.3 | 0.0 |
| 355 | 500 | 710 | -3.2 | -0.3 | 0.0 |
| 710 | 1000 | 1400 | 0.0 | 0.0 | 0.0 |
| 1400 | 2000 | 2800 | 1.2 | -0.1 | -0.2 |
| 2800 | 4000 | 5600 | 1.0 | -0.7 | -0.8 |
| 5600 | 8000 | 11200 | -1.1 | -2.9 | -3.0 |
| 11200 | 16000 | 22400 | -6.6 | -8.4 | -8.5 |
Further graphical customizations for the
 -axis are available by clicking the
Axes... button. For more information, see Section
29.9.9.
-axis are available by clicking the
Axes... button. For more information, see Section
29.9.9.
Specifying Output Options
You can write out the FFT data directly to a file by choosing the Write FFT to File option under Options in the Fourier Transform dialog box. Once the Write FFT to File option is selected, click the Write FFT button to display a file selection dialog box where you can choose a file and/or a location to hold the FFT data.
Further customizations for how the FFT data is displayed are available by clicking the Curves... button. For more information, see Section 29.9.10.
Specifying a Windowing Technique
You can use the various windowing techniques described in Section 29.11.2 by selecting any of the Window options in the Plot/Modify Input Signal dialog box. By default, None is selected so that no windowing technique is applied.
Specifying Labels and Titles
You can assign a title for your FFT plot using the
Plot Title text field. You can also assign
 -axis and
 -axis labels for your FFT plot using the
Y-Axis Label and
X-Axis Label text fields, respectively. By default,
ANSYS FLUENT assigns the
Y-Axis Label and the
X-Axis Label to the particular selection of
Y-Axis Function and
X-Axis Function.
-axis labels for your FFT plot using the
Y-Axis Label and
X-Axis Label text fields, respectively. By default,
ANSYS FLUENT assigns the
Y-Axis Label and the
X-Axis Label to the particular selection of
Y-Axis Function and
X-Axis Function.
Previous:
29.11.3 Fast Fourier Transform