![[ANSYS, Inc. Logo]](fluentlogo.gif)


|
|
|
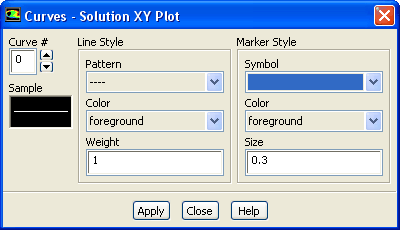
The data curves in XY plots and histograms can be represented by any combination of lines and markers. You can modify the attributes of the curves, including the patterns, weights, and colors of the lines, and the symbols, sizes, and colors of the markers. For each type of plot (solution XY, file XY, profile, residual, histogram, etc.), you can set different curve parameters in the Curves dialog box (Figure 29.9.14). Note that the title following Curves in the dialog box indicates which plot environment you are changing (e.g., the Curves - Solution XY Plot dialog box controls curve parameters for solution XY plots).
To open the Curves dialog box for a particular plot type, click the Curves... button in the appropriate dialog box (e.g., Solution XY Plot, File XY Plot, Plot Profile Data, Plot Interpolated Data, or Residual Monitors dialog box).
Using the
Curves Dialog Box
The Curves dialog box allows you to independently control the characteristics of each data curve in an XY plot or histogram. To set parameters for a curve, you will follow the procedure below:
Your changes to the curve attributes will appear in the graphics window the next time you generate a plot.
Changing the Line Style
You can control the pattern, color, and weight of the line using the controls under the Line Style heading:
|
|
If you do not want the data points to be connected by any type of line (i.e., if you plan to use just markers), select the "blank'' choice, which is the first item in the
Pattern list.
|
Changing the Marker Style
You can control the symbol, color, and size for the data marker using the controls under the Marker Style heading:
/*\ (filled-in upward-pointing triangle) could be used for the marker representing the upper surface data, and the symbol
\*/ (filled-in downward-pointing triangle) could be used for the marker representing the lower surface data.
|
|
If you do not want the data points to be represented by markers (i.e., if you plan to use just a line connecting the data points), select the "blank'' choice, which is the first item in the
Style list.
|
Previewing the Curve Style
To see what a particular setting will look like in the plot, you can preview it in the Sample window of the Curves dialog box. A single marker and/or line will be shown with the specified style attributes.
Previous:
29.9.9 Modifying Axis Attributes