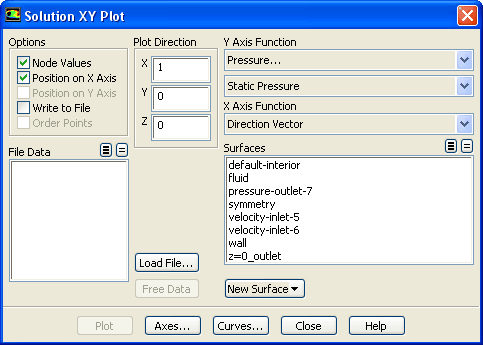
-
Options
contains check buttons that control the presentation of node or cell-averaged values, the selection of axis functions, and the ability to write the plot data to a file.
-
Node Values
toggles the node averaging of the data presented in the plot. If the option is inactive, cell values are presented. See Section
29.9.2 for details.
-
Position on X Axis, Position on Y Axis
set the
 -axis or
 -axis function to be the position. If one of these options is turned on, the other will automatically be turned off. You can turn both options off to generate a plot of one flow-field function vs. another, selecting the function for each axis using the
X Axis Function and
Y Axis Function drop-down lists.
-axis function to be the position. If one of these options is turned on, the other will automatically be turned off. You can turn both options off to generate a plot of one flow-field function vs. another, selecting the function for each axis using the
X Axis Function and
Y Axis Function drop-down lists.
-
Write to File
activates the file-writing option. When this option is selected, the
Plot push button will change to
Write.... Clicking on the
Write... button will open the
Select File dialog box (see Section
2.1.6) (Section
2.1.6 and Section
2.1.6), in which you can specify a name and save a file containing the plot data. The format of this file is described in Section
29.9.6.
-
Order Points
specifies that plot data being saved to a file should be sorted in order of ascending
 axis value. This option is available only when the
Write to File option is turned on.
axis value. This option is available only when the
Write to File option is turned on.
-
Plot Direction
contains inputs for defining the plot direction.
If
Direction Vector (the default) is selected in the
X Axis Function or
Y Axis Function drop-down list (whichever is the position axis), the inputs are the components of the direction vector. The position axis of the plot will have coordinate values that correspond to the dot product of the data coordinate vector with the plot direction vector. See Section
29.9.2 for details.
-
X
is the component in the
 direction.
-
Y
is the component in the
 direction.
-
Z
is the component in the
 direction.
If
Curve Length is selected in the
X Axis Function or
Y Axis Function drop-down list (whichever is the position axis), the inputs are the direction along the length of the surface selected in the
Surfaces list. See Section
29.9.2 for details.
-
Default
specifies the plot direction as the direction of increasing curve length.
-
Reverse
specifies the plot direction as the direction of decreasing curve length.
-
Show
displays the selected surface in the graphics window, marking the start of the surface with a blue dot and the end of the surface with a red dot.
ANSYS FLUENT will also display arrows on the surface showing the direction in which the variable will be plotted.
-
Y Axis Function, X Axis Function
contain lists of solution variables that can be used for the
 or
or
 axis of the plot. If the
Position on X Axis option is turned on,
X Axis Function will become a single drop-down list, containing two options:
Direction Vector (to plot the selected variable as a function of position along a specified direction vector) and
Curve Length (to plot the selected variable as a function of position along the length of a specified curvilinear surface). See Section
29.9.2 for details.
axis of the plot. If the
Position on X Axis option is turned on,
X Axis Function will become a single drop-down list, containing two options:
Direction Vector (to plot the selected variable as a function of position along a specified direction vector) and
Curve Length (to plot the selected variable as a function of position along the length of a specified curvilinear surface). See Section
29.9.2 for details.
Likewise, if
Position on Y Axis is turned on,
Y Axis Function will become a single drop-down list containing
Direction Vector and
Curve Length. If both
Position on X Axis and
Position on Y Axis are turned off, you can select field functions for both axes using the
X Axis Function and
Y Axis Function lists.
-
File Data
is a selectable list of the plot titles associated with the loaded external data files. You may choose any number of files for the data plot. The files are loaded using the
Load File... push button. The format of these files is presented in Section
29.9.6. See Section
29.9.2 for details.
-
Load File...
opens the
Select File dialog box (see Section
2.1.6) (Section
2.1.6 and Section
2.1.6), in which you can select the plot file to be read. See Section
29.9.2 for details. After the external file is loaded, its plot title will be displayed in the
File Data list.
-
Free Data
removes the files selected in the
File Data list.
-
Surfaces
is a selectable list of surfaces in the solution domain. You may choose any number of surfaces for the data plot.
-
New Surface
is a drop-down list button that contains a list of surface options:
-
Point
opens the
Point Surface dialog box.
-
Line/Rake
opens the
Line/Rake Surface dialog box.
-
Plane
opens the
Plane Surface dialog box.
-
Quadric
opens the
Quadric Surface dialog box.
-
Iso-Surface
opens the
Iso-Surface dialog box.
-
Iso-Clip
opens the
Iso-Clip dialog box.
-
Plot
plots the specified surface and/or file data in the active graphics window using the current axis and curve attributes. If the
Write to File option is turned on, this button becomes the
Write... button.
-
Write...
opens the
Select File dialog box (see Section
2.1.6) (Section
2.1.6 and Section
2.1.6), in which you can save the plot data to a file. This button replaces the
Plot button when the
Write to File option is turned on.
-
Axes...
opens the
Axes dialog box, which allows you to customize the plot axes.
-
Curves...
opens the
Curves dialog box, which allows you to customize the curves used in the XY plot.
![[ANSYS, Inc. Logo]](fluentlogo.gif)