The default colormap used by
ANSYS FLUENT to display graphical data (e.g., vectors) ranges from blue (minimum value) to red (maximum value). Additional predefined colormaps are available, and you can also create custom colormaps. To make any changes to the colormap, you will use the
Colormap dialog box (Figure
29.2.5).
Graphics and AnimationsColormap...
Figure 29.2.5: The
Colormap Dialog Box
(When you plot contours, you can temporarily modify the number of colors in the colormap by changing the number of contour levels in the
Contours dialog box; you will only need to use the
Colormap dialog box if you wish to change other characteristics of the colormap.)
Note that if you are using a gray-scale colormap and you wish to save a gray-scale picture,
you should actually save a color picture. When you save a gray-scale picture,
ANSYS FLUENT uses an internal gray scale, not the gray scale specified by the colormap. If you save a color picture, the colormap you selected (i.e., your gray scale) will be used.
Predefined Colormaps
The following colormaps are automatically available in
ANSYS FLUENT:
bgr:
Blue represents the minimum value, green the middle, and red the maximum value. Colors in between are interpolated from blue to green, and from green to red. (This is the default colormap.)
bgrb:
Blue represents the minimum and maximum values, and green and red are values 1/3 and 2/3 of the maximum value, respectively. Colors in between are interpolated from blue to green, from green to red, and from red to blue.
blue:
The minimum value is represented by blue-black, and the maximum value by pure blue.
cyan-yellow:
Cyan represents the minimum value and yellow represents the maximum value.
fea:
Blue represents the minimum value and red represents the maximum value. The colors in between are those used in third-party finite element analysis packages.
gray:
Black is used for the minimum value and white for the maximum value.
green:
The minimum value is represented by green-black, and the maximum value by pure green.
purple-magenta:
Purple represents the minimum value and magenta represents the maximum value.
red:
The minimum value is represented by red-black, and the maximum value by pure red.
rgb:
Red represents the minimum value, green the middle, and blue the maximum value. Colors in between are interpolated from red to green, and from green to blue.
The number of colors interpolated between the colors in the scale name (e.g., between purple and magenta) will depend on the size of the colormap.
Selecting a Colormap
The procedure for selecting a new colormap to be used in graphics displays is as follows:
1.
In the
Colormap dialog box (Figure
29.2.5), select the desired colormap in the
Currently Defined drop-down list. This list will contain all of the colormaps predefined by
ANSYS FLUENT as well as any custom colormaps that you have created as described below.
2.
Set the colormap size and scale as described below.
3.
Click
Apply to update the current graphics display with the new colormap. All future displays will use the newly selected colormap and options.
Specifying the Colormap Size and Scale
Once you have selected the desired colormap from the
Currently Defined list, you may modify the
Colormap Size. This value is the number of distinct colors in the color scale.
You can also choose to use a logarithmic scale instead of a decimal scale by turning on the
Log Scale option. With a log scale, the color used in the graphics display will represent the log of the value at that location in the domain. The values represented by the colors will, therefore, increase exponentially.
Changing the Number Format
You can change the format of the labels that define the color divisions at the left of the graphics window using the controls under the
Number Format heading in the
Colormap dialog box.
To display the real value with an integral and fractional part (e.g., 1.0000), select
float in the
Type drop-down list. You can set the number of digits in the fractional part by changing the value of
Precision.
To display the real value with a mantissa and exponent (e.g., 1.0e-02), select
exponential in the
Type drop-down list. You can define the number of digits in the fractional part of the mantissa in the
Precision field.
To display the real value with either float or exponential form, depending on the size of the number and the defined
Precision, choose
general in the
Type drop-down list.
Colormap Label Display
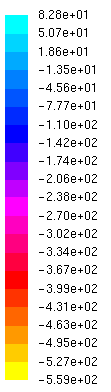
You can customize the number of values displayed on the colormap. The default number of labels that appear alongside the colormap depends on the font size and the colormap size (Figure
29.2.6). If you prefer to reduce the number of labels that appear alongside the colormap, then you must increase the number of labels skipped. To do so, deselect
Show All in the
Colormap dialog box and set the number of labels to be skipped. To demonstrate what effect this command has on the display, enter a value of
4 under
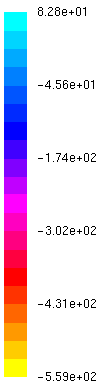
Skip (note that the value entered must be an integer). This will result in three intermediate labels being skipped, with the first and the last colormap values always being displayed (Figure
29.2.7). To reset the original colormap display, simply select
Show All.
Figure 29.2.6: The Default Colormap Label Display
Figure 29.2.7: The Colormap with Skipped Labels
Creating a Customized Colormap
You can create your own colormap by manipulating the "anchor colors'' and the colormap size. A color scale is created by linear interpolation between the anchor colors. The color, number, and position of the anchor colors will therefore control the description of the colormap. By increasing the colormap size, you can increase the total number of colors and obtain a color scale that changes more gradually.
2.
In the
Colormap Editor dialog box, select a color scale in the
Currently Defined list as your starting point. The colors in the scale will be displayed at the top of the dialog box. A white bar below a color is an "anchor point'' indicating that this color is an "anchor color''.
3.
If you want to add more colors to the color scale, increase the
Colormap Size; to use fewer colors, decrease this value. When you use the counter arrows (or type in a value and press
<Enter>), the color scale display at the top of the dialog box will be updated immediately.
The total number of colors must not be less than the number of anchor points.
4.
To obtain the desired color scale interpolation, manipulate the anchor colors as needed:
To add an anchor point, click any mouse button on the black space directly below the desired anchor color (or click on the color itself). A white bar will appear below the color to identify it as an anchor color, and the color will automatically be selected for color-definition modification.
To remove an anchor point, click on the white bar below the anchor color. The white bar will disappear and the color scale will be updated to reflect the new interpolation.
To select a current anchor color in order to modify its color definition, click on the color itself at the top of the dialog box.
To modify the color of the selected anchor color, you can change either the red/green/blue components (choose
RGB, the default) or the hue/saturation/value components (choose
HSV).
HSV is recommended if you plan to record the graphics display on video, as it allows you to create a more subtle gradation of color and reduce the tendency of bright colors to "bleed''. Move the
Red,
Green, and
Blue or
Hue,
Saturation, and
Value sliders to obtain the desired color. The color scale at the top of the dialog box will be updated automatically to show the effect of your change.
It is a good idea to note the original value of a color component before moving the slider so that you will be able to return to it if you change your mind. (See Section
2.1.6 for instructions on using a scale slider.)
If you make a mistake while modifying the color scale, you can start over by selecting the starting-point colormap in the
Currently Defined list.
5.
If you want to change the default name of the new colormap, enter the new name in the
Name field. By default, custom colormaps are called
cmap-0,
cmap-1, etc.
6.
Click
OK to save the new colormap. The colormap name will now appear in the
Currently Defined list in the
Colormap dialog box and can be selected for use in the graphics display.
Custom colormap definitions will be saved in the case file.
![[ANSYS, Inc. Logo]](fluentlogo.gif)


 Graphics and Animations
 Colormap...