![[ANSYS, Inc. Logo]](fluentlogo.gif)


|
|
|
You can draw vectors in the entire domain, or on selected surfaces. By default, one vector is drawn at the center of each cell (or at the center of each facet of a data surface), with the length and color of the arrows representing the velocity magnitude (Figure 29.1.18). The spacing, size, and coloring of the arrows can be modified, along with several other vector plot settings. Velocity vectors are the default, but you can also plot vector quantities other than velocity. Note that cell-center values are always used for vector plots; you cannot plot node-averaged values.
See also Section 29.1.5 for information about displaying vectors on a surface that sweeps through the domain.
Steps for Generating Vector Plots
You can plot vectors using the Vectors dialog box (Figure 29.1.19).
 Graphics and Animations

 Vectors
 Set Up...
The basic steps for generating a vector plot are as follows:
If you want to select several surfaces of the same type, you can select that type in the Surface Types list instead. All of the surfaces of that type will be selected automatically in the Surfaces list (or deselected, if they are all selected already).
Another shortcut is to specify a Surface Name Pattern and click Match to select surfaces with names that match the specified pattern. For example, if you specify wall*, all surfaces whose names begin with wall (e.g., wall-1, wall-top) will be selected automatically. If they are all selected already, they will be deselected. If you specify wall?, all surfaces whose names consist of wall followed by a single character will be selected (or deselected, if they are all selected already).
Displaying Relative Velocity Vectors
If you are solving your problem using one or more moving reference frames or moving meshes, you will have the option to display either the absolute vectors or the relative vectors. If you select Velocity (the default) in the Vectors of list, the vectors will be drawn based on the absolute, stationary reference frame. If you select Relative Velocity, the vectors will be drawn based on the reference frame of the Reference Zone in the Reference Values task page. See Section 30.11.2 for details. (If you are modeling a single rotating reference frame, you need not specify the Reference Zone; the vectors will be drawn based on the rotating reference frame.)
Vector Plot Options
The options mentioned in the procedure above include scaling the vector arrows, skipping the display of some vectors, displaying vectors in the plane of the data surface, displaying fixed-length or fixed-color vectors, displaying directional components of the vectors, specifying a range of values to be displayed, coloring the vectors by a different scalar field, including portions of the mesh in the vector display, and changing the style of the arrows or the scale of the arrowheads.
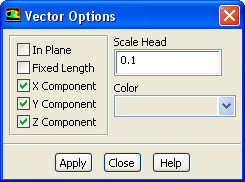
The most common options are set in the Vectors dialog box, and others are set in the Vector Options dialog box (Figure 29.1.20), which you can open by clicking on the Vector Options... button in the Vectors dialog box.
Scaling the Vectors
By default, vectors are scaled automatically so that the arrows overlap minimally when no vectors are skipped. (See below for instructions on thinning the vector display.) With the Auto Scale option, you can modify the Scale factor (which is set to 1 by default) to increase or decrease the vector scale from the default "auto scale''. The main advantage of autoscaling is that the vector display with a scale factor of 1 will always be appropriate, regardless of the size of the domain, giving you a better starting point for fine-tuning the vector scale.
If you turn off the Auto Scale option, the vectors will be drawn at their actual sizes scaled by the scale factor ( Scale, which is set to 1 by default). The "actual'' size of a vector is the magnitude of the vector variable (velocity, by default) at the point where it is drawn. A vector drawn at a point where the velocity magnitude is 100 m/s is drawn 100 m long, whether the domain is 0.1 m or 1000 m. You can modify the vector scale by changing the value of Scale in the Vectors dialog box until the size of the vectors (i.e., the actual size multiplied by Scale) is satisfactory.
Skipping Vectors
If your vector display is difficult to understand because there are too many arrows displayed, you can "thin out'' the vectors by changing the
Skip value in the
Vectors dialog box. By default,
Skip is set to 0, indicating that a vector will be drawn for each cell in the domain or for each face on the selected surface (e.g.,
 vectors). If you increase
Skip to 1, every other vector will be displayed, yielding
vectors). If you increase
Skip to 1, every other vector will be displayed, yielding
 vectors. If you increase
Skip to 2, every third vector will be displayed, yielding
vectors. If you increase
Skip to 2, every third vector will be displayed, yielding
 vectors, and so on. The order of faces on the selected surface (or cells in the domain) will determine which vectors are skipped or drawn; thus adaption and reordering will change the appearance of the vector display when a non-zero
Skip value is used.
vectors, and so on. The order of faces on the selected surface (or cells in the domain) will determine which vectors are skipped or drawn; thus adaption and reordering will change the appearance of the vector display when a non-zero
Skip value is used.
Drawing Vectors in the Plane of the Surface
For some problems, you may be interested in visualizing velocity (or other vector) components that are normal to the flow. These "secondary flow'' components are usually much smaller than the components in the flow direction and are difficult to see when the flow direction components are also visible. To easily view the normal flow components, you can turn on the In Plane option in the Vector Options dialog box. When this option is on, ANSYS FLUENT will display only the vector components in the plane of the surface selected for display. If the selected surface is a cross-section of the flow domain, you will be displaying the components normal to the flow.
Figure 29.1.21 shows velocity vectors generated using the In Plane option. (Note that these vectors have been translated outside the domain, as described in Section 29.6.3, so that they can be seen more easily.)
Displaying Fixed-Length Vectors
By default, the length of a vector is proportional to its velocity magnitude. If you want all of the vectors to be displayed with the same length, you can turn on the Fixed Length option in the Vector Options dialog box. To modify the vector length, adjust the value of the Scale factor in the Vectors dialog box.
Displaying Vector Components
All Cartesian components of the vectors are drawn by default, so that the arrow points along the resultant vector in physical space. However, sometimes one of the components, say, the
 component, is relatively large. In such cases, you may want to suppress the
 component and scale up the vectors, in order to visualize the smaller
 and
and
 components. To suppress one or more of the vector components, turn off the appropriate button(s) (
X,
Y, or
Z Component) in the
Vector Options dialog box.
components. To suppress one or more of the vector components, turn off the appropriate button(s) (
X,
Y, or
Z Component) in the
Vector Options dialog box.
Specifying the Range of Magnitudes Displayed
By default, the minimum and maximum vectors included in the vector display are set based on the range of vector-variable (velocity, by default) magnitudes in the entire domain. If you want to focus in on a smaller range of values, you can restrict the range to be displayed. The color scale for the vector display will change to reflect the new range of values. (You can also use the minimum and maximum values on the selected surfaces--rather than on the entire domain--to determine the range, or change the scalar field by which the vectors are colored from velocity magnitude to any other scalar, as described below.)
To manually set the range of velocity magnitudes (or the range of whatever scalar field is selected in the Color by drop-down list), turn off the Auto Range option in the Vectors dialog box. The Min and Max fields will become editable, and you can enter the new range of values to be displayed. For example, if you want to display velocity vectors only in regions where the velocity magnitude exceeds 150 m/s but is less than 300 m/s, you will change the value of Min to 150 and the value of Max to 300. Similarly, if you are coloring the vectors by static pressure, you can choose to display velocity vectors only in regions where the pressure is within a specified range. To show the default range at any time, click the Compute button and the Min and Max fields will be updated.
When you restrict the range of vectors displayed, you can also control whether or not values outside the prescribed Min/ Max range are displayed. To leave areas in which the value is outside the specified range empty (i.e., draw no vectors), turn on the Clip to Range option. This is the default setting. If you turn Clip to Range off, values below the Min value will be colored with the lowest color on the color scale, and values above the Max value will be colored with the highest color on the color scale. This feature is the same as the one available for displaying filled contours (see Figures 29.1.16 and 29.1.17).
You can also choose to base the minimum and maximum values on the range of values on the selected surfaces, rather than the entire domain. To do this, turn off the Global Range option in the Vectors dialog box. The Min and Max values will be updated when you next click Compute or Display.
Changing the Scalar Field Used for Coloring the Vectors
If you want to color the vectors by a scalar field other than velocity magnitude (the default), you can select a different variable or function in the Color by drop-down list. Select the desired category in the upper list, and then choose one of the related quantities from the lower list. If you choose static pressure, for example, the length of the vectors will still correspond to the velocity magnitude, but the color of the vectors will correspond to the value of pressure at each point where a vector is drawn.
Displaying Vectors Using a Single Color
If you want all of the vectors to be the same color, you can select the color to be used in the Color drop-down list in the Vector Options dialog box. If no color is selected (i.e., if you choose the empty space at the top of the drop-down list--the default selection), the vector color will be determined by the Color by field specified in the Vectors dialog box. Single color vectors are useful in displays that overlay contours and vectors.
Including the Mesh in the Vector Plot
For some problems, especially complex 3D geometries, you may want to include portions of the mesh in your vector plot as spatial reference points. For example, you may want to show the location of an inlet and an outlet along with the vectors. This is accomplished by turning on the Draw Mesh option in the Vectors dialog box. The Mesh Display dialog box will appear automatically when you turn on the Draw Mesh option, and you can set the mesh display parameters there. When you click Display in the Vectors dialog box, the mesh display, as defined in the Mesh Display dialog box, will be included in the vector plot.
Changing the Arrow Characteristics
There are five different styles available for drawing the vector arrows. Choose cone, filled-arrow, arrow, harpoon, or headless in the Style drop-down list in the Vectors dialog box. The default arrow style is harpoon.
If you choose a vector arrow style that includes heads, you can control the size of the arrowhead by modifying the Scale Head value in the Vector Options dialog box.
Creating and Managing Custom Vectors
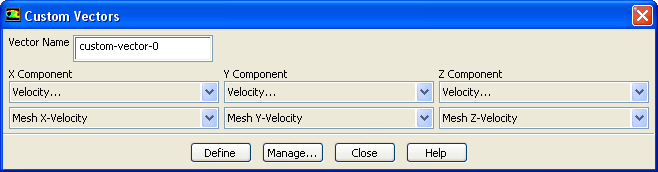
In addition to the velocity vector quantity provided by ANSYS FLUENT, you can also define your own custom vectors to be plotted. This capability is available with the Custom Vectors dialog box.
Any custom vectors that you define will be saved in the case file the next time that you save it. You can also save your custom vectors to a separate file, so that they can be used with a different case file.
Creating Custom Vectors
To create your own custom vector, you will use the Custom Vectors dialog box (Figure 29.1.22). This dialog box allows you to define custom vectors based on existing quantities. Any vectors that you define will be added to the Vectors of list in the Vectors dialog box.
To open the Custom Vectors dialog box, click the Custom Vectors... button in the Vectors dialog box.
The steps for creating a custom vector are as follows:
|
|
Be sure that you do not specify a name that is already used for a standard vector (e.g.,
velocity or
relative-velocity).
|
 component of the vector in the
X Component drop-down list. First select the desired category in the upper list; you may then select a related quantity in the lower list. (See Chapter
31 for an explanation of the variables in the list.)
component of the vector in the
X Component drop-down list. First select the desired category in the upper list; you may then select a related quantity in the lower list. (See Chapter
31 for an explanation of the variables in the list.)
 component (and, in 3D, the
 component) of the custom vector.
|
|
You can use the
Custom Vectors option to plot vectors in solid cell zones. The scalars that are selected in the
 , ,
 components (and, in 3D, the components (and, in 3D, the
 component), and which are valid in solid regions, will have vector plots displayed in the solid cell zones. Note that if a vector has no valid components in the solid region, then that vector will not be plotted in the solid region. However, if at least one component of the vector is valid in the solid region, then only that component of the vector will be plotted. component), and which are valid in solid regions, will have vector plots displayed in the solid cell zones. Note that if a vector has no valid components in the solid region, then that vector will not be plotted in the solid region. However, if at least one component of the vector is valid in the solid region, then only that component of the vector will be plotted.
|
Manipulating, Saving, and Loading Custom Vectors
Once you have defined your vectors, you can manipulate them using the Vector Definitions dialog box (Figure 29.1.23). You can display a vector definition to be sure that it is correct, delete the vector if you decide that it is incorrect and needs to be redefined, or give the vector a new name. You can also save custom vectors to a file or read them from a file. The custom vector file allows you to transfer custom vectors between case files.
To open the Vector Definitions dialog box, click the Manage... button in the Custom Vectors dialog box.
The following actions can be performed in the Vector Definitions dialog box:
|
|
Be sure that you do not specify a name that is already used for a standard vector (e.g.,
velocity or
relative-velocity).
|
Previous:
29.1.2 Displaying Contours and