![[ANSYS, Inc. Logo]](fluentlogo.gif)


|
|
|
You can set up your case file so that drag, lift, and moment coefficients are computed and stored at the end of every iteration (for steady-state solutions) or time step (for transient solutions), and thus create a convergence history. You can print and plot this convergence data, and also save it to an external file. The external file is written in the ANSYS FLUENT XY plot file format described in Section 29.9.6. Monitoring force coefficients can be useful when you are calculating external aerodynamics, for example, and are especially interested in the lift coefficient. By monitoring these values you may also be able to stop the calculation early and reduce the processing time, as sometimes the force and moment coefficients converge before the residuals have decreased three orders of magnitude. (In such an instance, you should be sure to check the mass flow rate and heat transfer rate as well, to ensure that the mass and energy are being suitably conserved. This is accomplished using the Flux Reports dialog box, as described in Section 30.3.)
|
|
The force and moment coefficients are calculated using the reference values
entered in the
Reference Values task page. For information about how these coefficients are calculated, see
this section in the separate
Theory Guide.
|
Setting Up Force and Moment Coefficient Monitors
To begin setting up a force or moment monitor, first enter appropriate values in the Reference Values task page, as described in Section 30.11. The relevant values include the following:
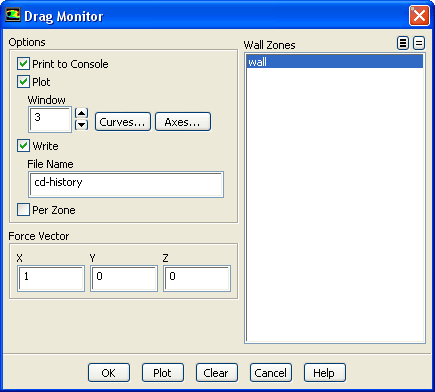
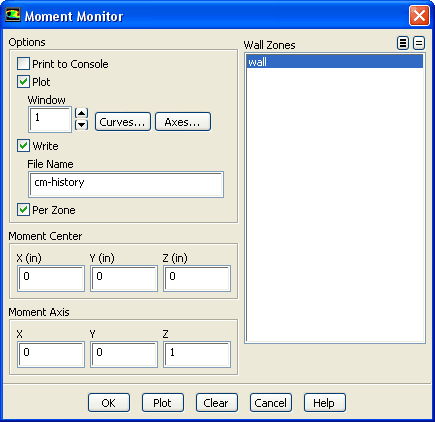
Next, open the appropriate dialog box using the Monitors task page. Select either Drag, Lift, or Moment from the Residuals, Statistic and Force Monitors selection list and click the Edit... button to open the Drag Monitor dialog box, Lift Monitor dialog box, or Moment Monitor dialog box, respectively (Figures 26.13.4- 26.13.6). Note that you can only access one of these monitor dialog boxes at a time, though all three monitors can be used during the same simulation.
 Monitors

 Drag
Drag
 Edit...
 Monitors

 Lift
Lift
 Edit...
 Monitors

 Moment
 Edit...
Complete the setup of the force or moment coefficient monitor by performing the following steps in the Drag Monitor, Lift Monitor, or Moment Monitor dialog box:
 direction, whereas for the lift coefficient it is a unit vector in the
 direction.
 direction.
After you have set up all of the force and moment coefficient monitors, you can then run the calculation and view the data in the console window, graphics window, or file.
|
|
Only the processed force and moment coefficient data is saved. If you decide to change any of the parameters controlling the monitoring (e.g., the reference values, force vector, moment center, moment axis, wall zones) and run further calculations, you may see a discontinuity in the data, because the previous data is not updated to match the new settings. Usually, you will want to delete the previous force and moment coefficient data before continuing to iterate with revised monitor parameters.
|
Specifying the Reporting Methods
There are three methods available for reporting the force and moment coefficients. To display the coefficient value(s) in the console window after every iteration or time step, enable the Print to Console option in the Options group box of the monitor dialog box. To plot the coefficient in the graphics window indicated in the Window text box, enable the Plot option. If you want to save the data to a file, enable the Write option and specify the File Name. You can enable any combination of these options simultaneously.
|
|
If you choose
not to save the force or moment coefficient data in a file, this information will be lost when you exit the current
ANSYS FLUENT session.
|
You can display a plot of the coefficient monitor data generated during the last calculation even if the Plot option was not enabled during the calculation, as long as either Print to Console or Write was enabled. Simply click the Plot button and the plot will be displayed in the active graphics window (if the Plot option is not enabled) or in the specified Window (if the Plot option is enabled).
Plot Parameters
If you choose to plot the force or moment coefficients (either by enabling the Plot option prior to running the solution or by clicking the Plot button after the calculation is complete), there are several display parameters you can modify:
Monitoring Individual Walls
By default, ANSYS FLUENT will compute and monitor the sum of the force or moment coefficients for all of the selected walls. If you have selected multiple walls and you want to monitor the force or moment coefficient on each wall separately, you can enable the Per Zone option in the Options group box in the monitor dialog box. The specified force vector or moment center and axis will apply to all of the selected walls.
If the monitor results are displayed in the console window (using the Print to Console option), the force or moment coefficient for each wall zone will be printed in a separate column. If the results are plotted (using the Plot option or button), a separate curve for each wall zone will be drawn in the specified graphics window. If the results are written to a file (using the Write option), the file will be in a tab-separated column format based on the XY plot file format described in Section 29.9.6.
Discarding the Monitor Data
Should you decide that the data gathered by the force or moment monitor is not useful (e.g., if you are restarting the calculation with revised reference values), you can discard the data accumulated during the last calculation by clicking the Clear button. All of the data gathered as a result of the settings in that monitor dialog box will be deleted, including the associated file (with the name indicated in the File Name text box). When you use the Clear button, you will need to confirm the data discard in a Question dialog box (see Section 2.1.6). Only the coefficient monitor data is discarded as a result of this operation; the solution data is not affected.
Previous:
26.13.2 Monitoring Statistics