![[ANSYS, Inc. Logo]](fluentlogo.gif)


|
|
|
If you are solving a fully-developed periodic flow, you may want to monitor the pressure gradient or the bulk temperature ratio, as discussed in Section 9.2.
If you are solving an unsteady flow (especially if you are using the explicit time stepping option), you may want to monitor the "time'' that has elapsed during the calculation. The physical time of the flow field starts at zero when you initialize the flow. (See Section 26.12 for details about modeling unsteady flows.)
If you are using the adaptive time stepping method described in Section
26.12.2, you may want to monitor the size of the time step,
 .
.
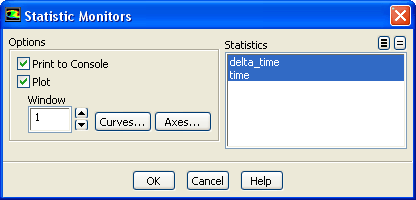
You can use the Statistic Monitors dialog box (Figure 26.13.3) to print or plot these quantities during the calculation.
 Monitors

 Statistic
 Edit...
The procedure for setting up this monitor is listed below:
Plot Parameters
If you choose to plot the statistics, there are several display parameters you can modify.
In the Window field, you can specify the ID of the graphics window in which the plot will be drawn (or in which the first plot will be drawn, if you are plotting more than one quantity.) When ANSYS FLUENT is iterating, the active graphics window is temporarily set to this window to update the plot, and then returned to its previous value. Thus, the statistics plot can be maintained in a separate window that does not interfere with other graphical postprocessing. Note that additional quantities that you have selected in the Statistics list will be plotted in windows with incrementally higher IDs.
You can also modify the attributes of the plot axes and curves. Click the Axes... or Curves... button to open the Axes dialog box or Curves dialog box. See Sections 29.9.9 and 29.9.10 for details.
Previous:
26.13.1 Monitoring Residuals