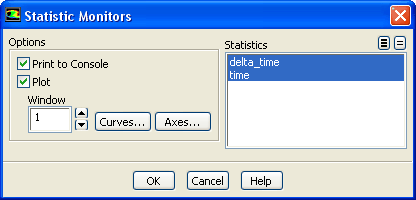
You can use the
Statistic Monitors dialog box to control the statistics information that
ANSYS FLUENT reports. See Section
26.13.2 for details about using this dialog box.
Controls
Options
selects the following methods for reporting statistics:
Print to Console
specifies whether or not to print the selected statistics in the console window after each iteration.
Plot
specifies whether or not to plot each of the selected statistics in a separate graphics window after each iteration. The windows that the plots appear in are determined by the
First Window option below.
Statistics
contains a list of statistics from which you can select those that are to be plotted. The availability of
per/pr-grad is restricted to specified-mass-flow periodic flow calculations while
per/bulk-temp-ratio is available only for specified-mass-flow periodic heat transfer calculations. Similarly,
time and
delta_time are available only if you are modeling unsteady flow.
Window
sets the window ID for the plot of the first statistic selected. The remaining selected statistics will be plotted in windows with incrementally higher IDs.
Axes...
opens the
Axes dialog box to modify the attributes of the axes.
Curves...
opens the
Curves dialog box to modify the attributes of the data curves.
![[ANSYS, Inc. Logo]](fluentlogo.gif)