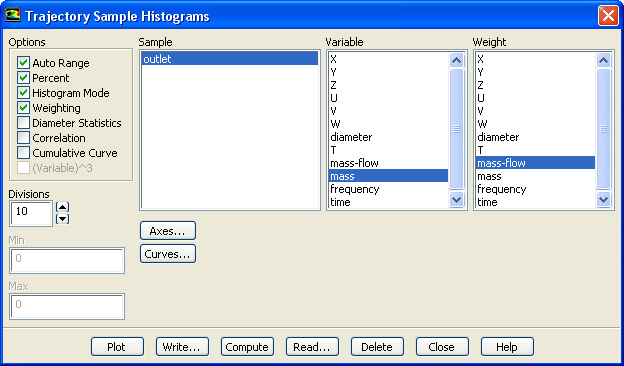
The
Trajectory Sample Histograms dialog box allows the plotting of histograms from sample files created in the
Sample Trajectories dialog box. See Section
23.7.7 for details about the items below.
Controls
Options
contains check buttons for histogram options.
Auto Range
toggles between automatic and manual settings of the histogram range.
Percent
causes the plot to indicate the percent of particles. Deselecting this will result in the actual number of particles being plotted.
Histogram Mode
allows you to display the histogram with or without bars.
Weighting
allows you to apply a weight to the data sample.
Diameter Statistics
allows you to display a summary of diameter statistics for a selected variable in the console window.
Correlation
allows you to choose correlations between how one particle variable depends on another particle variable.
Cumulative Curve
allows you to compute a cumulative distribution curve for a selected variable.
(Variable)
allows you to plot the cumulative mass distribution for a constant particle density using the particle diameter.
Divisions
sets the number of "bins'' in the histogram.
Sample
lists the data samples that have been read in.
Variable
lists the fields variables available in the selected sample.
Weight
lists the weighted fields variables available in the selected sample.
Correlation
lists the sampled variables, allowing you to choose the correlation variable.
Min
displays the minimum value of the variable selected in the
Variable list. If
Auto Range is off, you can set the minimum by typing a new value.
Max
displays the maximum value of the variable selected in the
Fields list. If
Auto Range is off, you can set the maximum by typing a new value.
Axes...
opens the
Axes dialog box, which allows you to customize the histogram axes.
Curves...
opens the
Curves dialog box, which allows you to customize the curves used in the histogram.
Plot
displays the histogram in the active graphics window.
Write...
allows you store the histograms in an XY-plot file format
Compute
updates the
Min and
Max values.
Read...
opens the
Select File dialog box (see Section
2.1.6), where you can select a sample file to be read.
Delete
removes the sample selected in the
Sample list.
![[ANSYS, Inc. Logo]](fluentlogo.gif)


 allows you to plot the cumulative mass distribution for a constant particle density using the particle diameter.