![[ANSYS, Inc. Logo]](fluentlogo.gif)


|
|
|
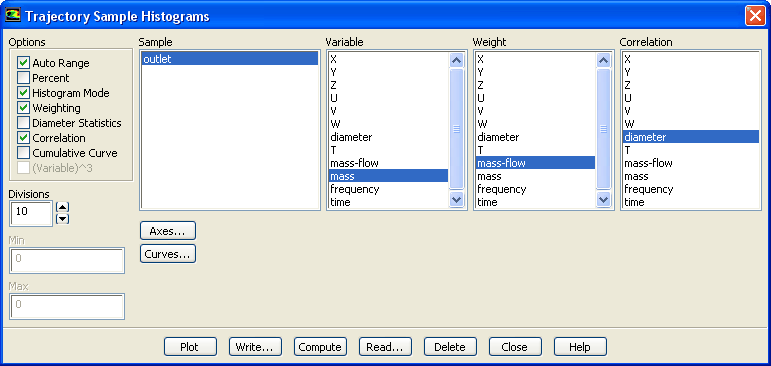
Histograms can be plotted from sample files created in the Sample Trajectories dialog box (as described in Section 23.7.6) using the Trajectory Sample Histograms dialog box (Figure 23.7.5).
 Reports

 Histogram
 Set Up...
The procedure for plotting histograms from data in a sample file is listed below:
By default, the percent of particles will be plotted on the
 axis. You can plot the actual number of particles by deselecting
Percent under
Options. The number of "bins'' or intervals in the plot can be set in the
Divisions field. You can delete samples from the list with the
Delete button and update the
Min/Max values with the
Compute button. To display the histogram without the bars, deselect
Histogram Mode under
Options. A summary similar to that in Section
23.7.8 will be displayed in the console for the selected variables when
Diameter Statistics is enabled. Although these statistics are computed for the selected variable in the
Variable list, it is applicable only to the diameter information. When the sampled particle streams all have the same flow rate, you can disable the
Weighting. To postprocess the histograms with other tools, you can store them in an XY-plot file format using the
Write... button.
axis. You can plot the actual number of particles by deselecting
Percent under
Options. The number of "bins'' or intervals in the plot can be set in the
Divisions field. You can delete samples from the list with the
Delete button and update the
Min/Max values with the
Compute button. To display the histogram without the bars, deselect
Histogram Mode under
Options. A summary similar to that in Section
23.7.8 will be displayed in the console for the selected variables when
Diameter Statistics is enabled. Although these statistics are computed for the selected variable in the
Variable list, it is applicable only to the diameter information. When the sampled particle streams all have the same flow rate, you can disable the
Weighting. To postprocess the histograms with other tools, you can store them in an XY-plot file format using the
Write... button.
When investigating the behavior of particles, it is sometimes desirable to know how one type of particle variable depends on another particle variable. To facilitate this, the Correlation option exists. When you enable this option, an additional column of sampled variables appears, allowing you to choose the correlation variable (see Figure 23.7.6).
If you want to know the continuous cumulative distributions, enable the
Cumulative Curve option. A cumulative distribution curve is computed of the variable which is selected in the
Variable list. However, if the
Correlation option is enabled along with the
Cumulative Curve, then the cumulative curve of the variable selected in the
Correlation list is plotted. For a constant particle density, you can plot the cumulative mass distribution by selecting the diameter and enabling
(Variable)^3.
Previous:
23.7.6 Sampling of Trajectories