![[ANSYS, Inc. Logo]](fluentlogo.gif)


|
|
|
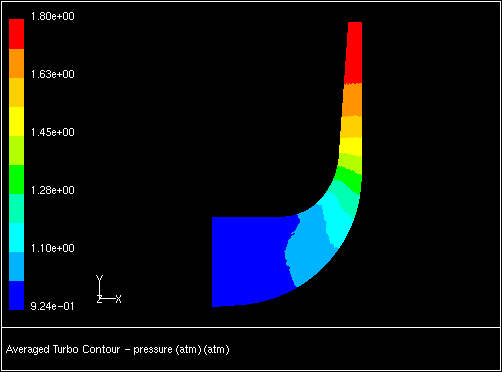
Turbo averaged contours are generated as projections of the values of a variable averaged in the circumferential direction and visualized on an
 -
-
 plane. A sample plot is shown in Figure
29.10.7.
plane. A sample plot is shown in Figure
29.10.7.
Steps for Generating Turbomachinery Averaged Contour Plots
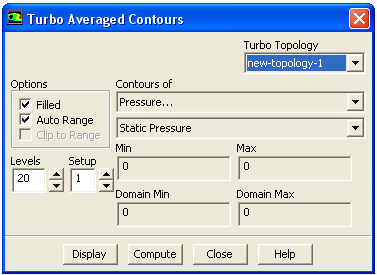
You can display contours using the Turbo Averaged Contours dialog box (Figure 29.10.6).
Turbo
 Averaged Contours...
The basic steps for generating a turbo averaged contour plot are as follows:
The resulting display will include the specified number of contours of the selected variable, with the magnitude on each one determined by equally incrementing between the values shown in the Min and Max fields.
Note that the Min and Max values displayed in the dialog box are the minimum and maximum averaged values. These limits will in general be different from the global Domain Min and Domain Max, which are also displayed for your reference (see Figure 29.10.6).
Contour Plot Options
The options mentioned in the procedure above include drawing color-filled contours (instead of line contours), specifying a range of values to be contoured, and storing the contour plot settings. These options are the same as those in the standard Contours dialog box. See Section 29.1.2 for details about using them.
Previous:
29.10.2 Generating Reports of