![[ANSYS, Inc. Logo]](fluentlogo.gif)


|
|
|
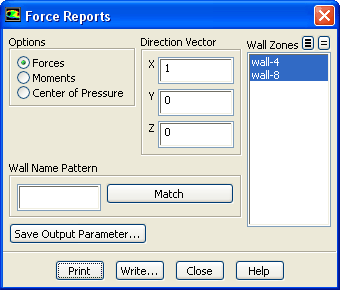
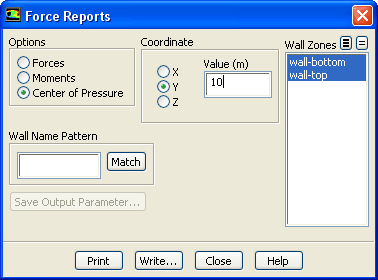
To obtain a report (for selected wall zones) of forces along a specified vector, moments about a specified center and along a specified axis, or the center of pressure, use the Force Reports dialog box (Figure 30.4.1).
 Reports

 Forces
 Set Up...
The steps for generating the report are as follows:
 ). Select the axis (
X,
Y, or
Z) in the
Coordinate group box, and then enter the fixed
Value. See the example at the end of this section for further details.
). Select the axis (
X,
Y, or
Z) in the
Coordinate group box, and then enter the fixed
Value. See the example at the end of this section for further details.
|
|
If
 (the (the
 -component of the force) is zero, then either the
Y or
Z coordinate can be fixed. If -component of the force) is zero, then either the
Y or
Z coordinate can be fixed. If
 is zero, then either the
X or
Z coordinate can be fixed. If is zero, then either the
X or
Z coordinate can be fixed. If
 is zero, then either the
X or
Y coordinate can be fixed. is zero, then either the
X or
Y coordinate can be fixed.
|
If you have a large number of wall zones, it may be useful to specify a Wall Name Pattern and click Match. This selects all of the wall zones with names that match the specified pattern. For example, if you specify out*, all walls whose names begin with out (e.g., outer-wall-top, outside-wall) will be selected automatically. If a wall zone that matches the name pattern is already selected when Match is clicked, it will be deselected. If you specify out?, all walls whose names consist of out followed by a single character will be selected (or deselected, if they are already selected).
After the output parameter is created, it is listed in the Parameters dialog box. You can create any number of output parameters of this report type.
If you selected Forces under Options, the pressure force, viscous force (if appropriate), total forces, pressure coefficient, viscous coefficient, and total coefficients for each selected wall zone will be displayed or saved.
If you selected Moments, the pressure moments, viscous moments (if appropriate), total moments, pressure coefficient, viscous coefficient and total coefficients for the wall zones about the specified center will be displayed or saved. Additionally, the moments and coefficients in the direction of the specified axis will be displayed or saved. The report will include the values for the individual wall zones, as well as the net values for all of the wall zones combined. See this section in the separate Theory Guide for details about computing forces and moments.
If you selected Center of Pressure, then ANSYS FLUENT displays or saves the coordinates about which the moment is zero.
|
|
You cannot save your output parameter if
Center of Pressure is selected.
|
|
|
Note that the reported force and moment coefficients are a function of the values entered in the
Reference Values task page (as described in
this section in the separate
Theory Guide). Therefore, appropriate values must be entered in the
Reference Values task page to get meaningful results.
|
Example
To demonstrate how you would generate and interpret the center of pressure report, consider an airfoil of chord length 1 m (shown in Figure 30.4.2).
Open the Force Reports dialog box and perform the steps that follow.
 Reports

 Forces
 Set Up...
The report generated will be in the following form:
Pressure Center Coordinates (in m): X = 0.41267981 Y = 10 |
Previous:
30.4 Forces on Boundaries