- 1.
Increase pixelation for accuracy.
 Models

 Radiation
 Edit...
-
For semi-transparent and reflective surfaces, increasing accuracy by increasing pixilation is more efficient than increasing theta and phi divisions.
- (a)
Set both
Theta Pixels and
Phi Pixels to
2.
- (b)
Click
OK to close the
Radiation Model dialog box.
- 2.
Request 1000 more iterations.
 Run Calculation
-
The solution will converge in approximately 100 additional iterations.
- 3.
Save the case and data files (
do_2x2_2x2_pix.cas.gz and
do_2x2_2x2_pix.dat.gz).
File
 Write
Write
 Case & Data...
- 4.
Display temperature profile for the
lens-inner.
 Plots
Plots

 XY Plot
 Set Up...
- (a)
Disable
Write to File.
- (b)
Retain the default settings and plot the temperature profile.
- (c)
Enable
Write to File and click the
Write... button to open the
Select File dialog box.
- i.
Enter
do_2x2_2x2_pix.xy for
XY File and close the
Select File dialog box.
- (d)
Click the
Load File... button to open the
Select File dialog box.
- i.
Select
do_2x2_1x1.xy and click
OK to close the
Select File dialog box.
- (e)
Click the
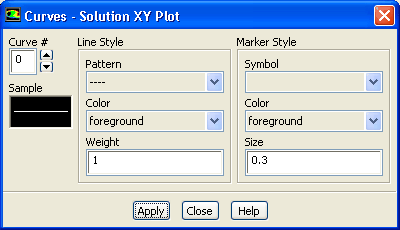
Curves... button to open
Curves - Solution XY Plot dialog box.
- i.
Set
Curve
# to
1.
- ii.
Select the line pattern as shown in the
Curves - Solution XY Plot dialog box.
- iii.
Select the symbol pattern as shown in the
Curves - Solution XY Plot dialog box.
- iv.
Click
Apply and close the
Curves - Solution XY Plot dialog box.
- (f)
Disable
Write to File.
- (g)
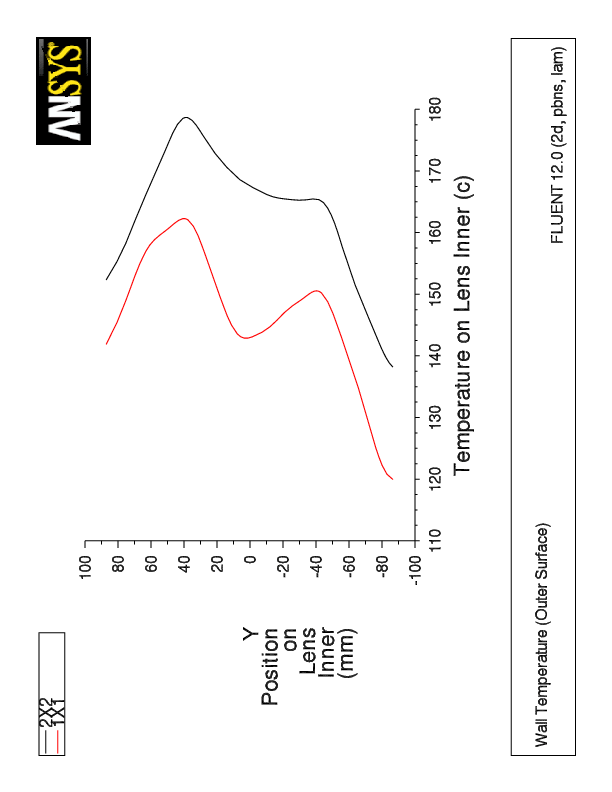
Click
Plot (Figure
6.7).
Figure 6.7: Temperature Profile for
lens-inner
 |
- (h)
Close the
Solution XY Plot dialog box.
- 5.
Increase both
Theta Pixels and
Phi Pixels to
3 and continue iterations.
 Models

 Radiation
 Edit...
- 6.
Click the
Calculate button.
 Run Calculation
-
The solution will converge in approximately 100 additional iterations.
- 7.
Save the case and data files (
do_2x2_3x3_pix.cas.gz and
do_2x2_3x3_pix.dat.gz).
File
 Write
Write
 Case & Data...
- 8.
Display temperature profile for the
lens-inner.
 Plots
Plots

 XY Plot
 Set Up...
- (a)
Make sure
Write to File is disabled.
- (b)
Ensure that all files are deselected from the
File Data selection list.
- (c)
Ensure that
lens-inner is selected from the
Surfaces selection list.
- (d)
Click
Plot.
- (e)
Click
Write to File and save the file as
do_2x2_3x3_pix.xy.
- 9.
Repeat the procedure for 10
Theta Pixels and
Phi Pixels and save the case and data files (
do_2x2_10x10_pix.cas.gz and
do_2x2_10x10_pix.dat.gz).
- (a)
Save the file as
do_2x2_10x10_pix.xy.
- 10.
Read in all the files and plot them.
 Plots
Plots

 XY Plot
 Set Up...
- (a)
Click the
Load File... button to open the
Select File dialog box.
- i.
Select all the xy files and close the
Select File dialog box.
-
Note:
Selected files will be listed in the
XY File(s) selection list.
-
Make sure you deselect
lens-inner from the
Surfaces list so that there is no duplicated plot.
- (b)
Click the
Curves... button to open
Curves - Solution XY Plot dialog box.
-
Make sure you deselect
lens-inner from the
Surfaces list so that there is no duplicated plot.
- i.
Select the line pattern as shown in the
Curves - Solution XY Plot dialog box.
- ii.
Select the symbol pattern as shown in the
Curves - Solution XY Plot dialog box.
- iii.
Click
Apply to save the settings for curve zero.
- iv.
Set
Curve
# to
1.
- v.
Follow the above instructions for curves 2, 3, and 4.
- vi.
Click
Apply and close the
Curves - Solution XY Plot dialog box.
- (c)
Click
Plot (Figure
6.8).
- (d)
Close the
Solution XY Plot dialog box.
Figure 6.8: Temperature Profile
 |
-
Note:
The keys in this plot are changed for better comparison. You may ignore this and proceed further.
![[ANSYS, Inc. Logo]](fluentlogo.gif)