[ANSYS, Inc. Logo] return to home search
next up previous contents

Step 8: Postprocessing

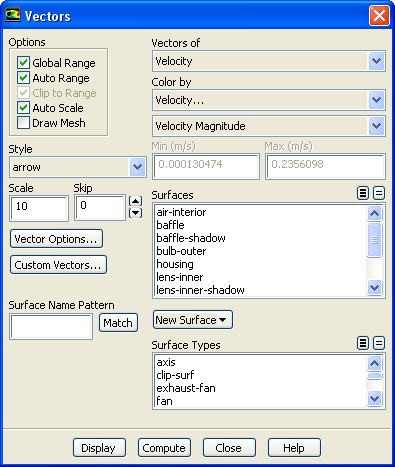
1.   Display velocity vectors.

figure Graphics and Animations figure figure Vectors figure Set Up...

figure

(a)   Enter 10 for Scale.

(b)   Retain the default selection of Velocity from the Vectors of drop-down list.

(c)   Retain the default selection of Velocity... and Velocity Magnitude from the Color by drop-down list.

(d)   Click Display (Figure  6.4).

(e)   Close the Vectors dialog box.

Figure 6.4: Vectors of Velocity Magnitude
figure

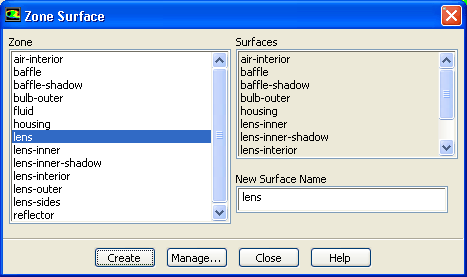
2.   Create the new surface, lens.

Surface $\rightarrow$ Zone...

figure

(a)   Select lens from the Zone selection list.

(b)   Click Create and close the Zone Surface dialog box.

3.   Display contours of static temperature.

figure Graphics and Animations figure figure Contours figure Set Up...

figure

(a)   Enable Filled in the Options group box.

(b)   Disable Global Range in the Options group box.

(c)   Select Temperature... and Static Temperature from the Contours of drop-down lists.

(d)   Select lens from the Surfaces selection list.

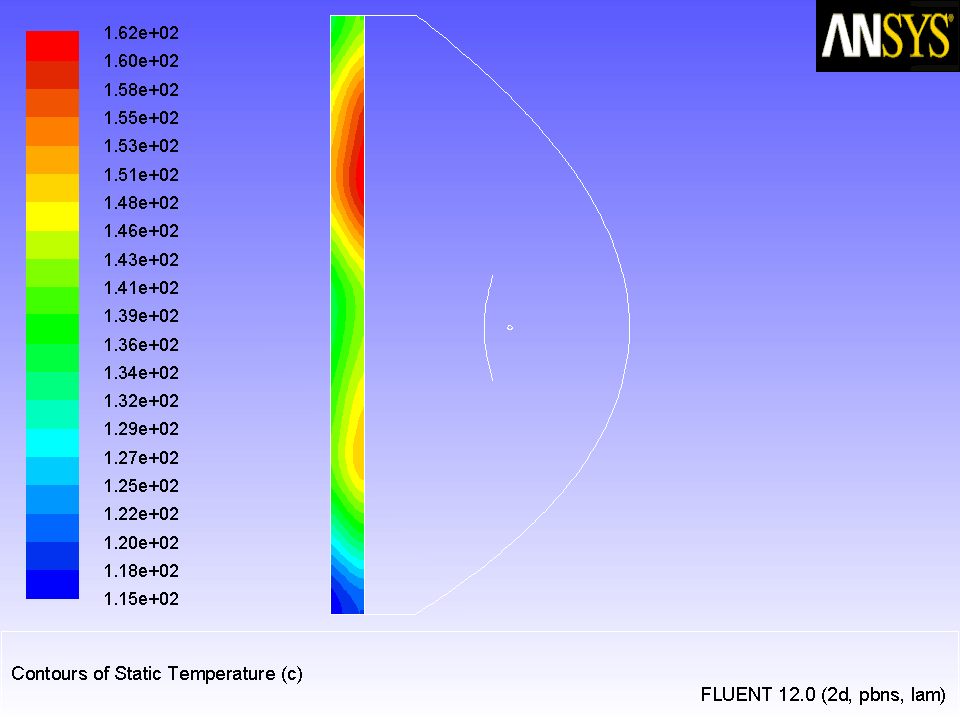
(e)   Click Display (Figure  6.5).

Figure 6.5: Contours of Static Temperature
figure

(f)   Close the Contours dialog box.

4.   Display temperature profile for the lens-inner.

figure Plots figure figure XY Plot figure Set Up...

figure

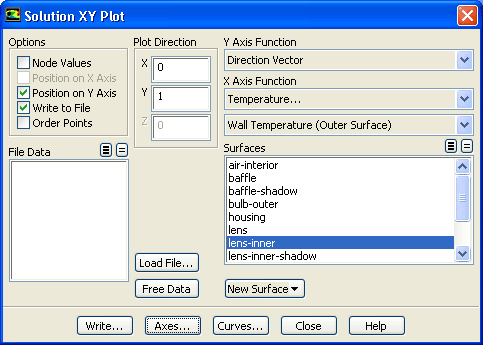
(a)   Disable both Node Values and Position on X Axis in the Options group box.

(b)   Enable Position on Y Axis.

(c)   Enter 0 and 1 for X and Y in the Plot Direction group box.

(d)   Retain the default selection of Direction Vector from the Y Axis Function drop-down list.

(e)   Select Temperature... and Wall Temperature (Outer Surface) from the X Axis Function drop-down lists.

(f)   Select lens-inner from the Surfaces selection list.

(g)   Click the Axes... button to open the Axes - Solution XY Plot dialog box.

figure

i.   Ensure that X is selected in the Axis list.

ii.   Enter Temperature on Lens Inner for Label.

iii.   Select float from the Type drop-down list in the Number Format group box.

iv.   Set Precision to 0.

v.   Click Apply.

figure

vi.   Select Y in the Axis list.

vii.   Enter Y Position on Lens Inner for Label.

viii.   Select float from the Type drop-down list in the Number Format group box.

ix.   Set Precision to 0.

x.   Click Apply and close the Axes - Solution XY Plot dialog box.

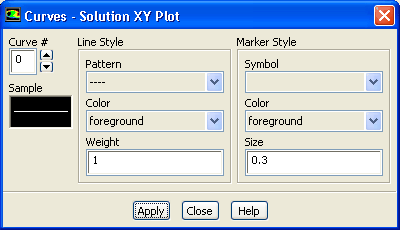
(h)   Click the Curves... button to open the Curves - Solution XY Plot dialog box.

figure

i.   Select the line pattern as shown in the Curves - Solution XY Plot dialog box.

ii.   Select the symbol pattern as shown in the Curves - Solution XY Plot dialog box.

iii.   Click Apply and close the Curves - Solution XY Plot dialog box.

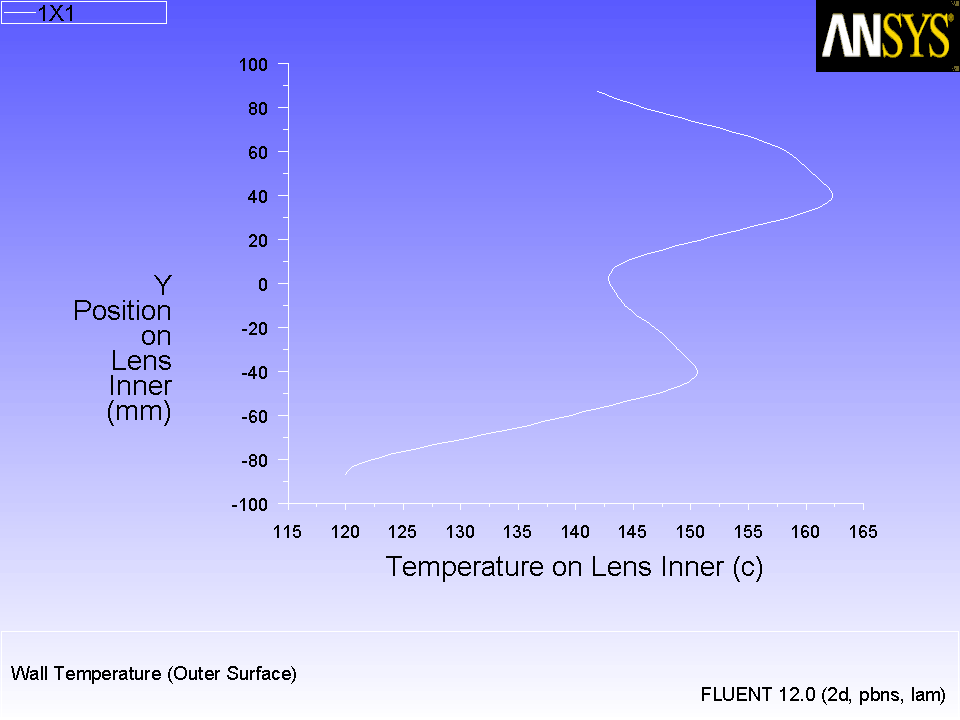
(i)   Click Plot (Figure  6.6).

Figure 6.6: Temperature Profile for lens-inner
figure

(j)   Enable Write to File and click the Write... button to open the Select File dialog box.
i.   Enter do_2x2_1x1.xy for XY File and close the Select File dialog box.

(k)   Close the Solution XY Plot dialog box.

  The key in this plot is changed to 1x1 instead of lens-inner.


next up previous contents Previous: Step 7: Solution
Up: Using the Discrete Ordinates
Next: Step 9: Iterate for
Release 12.0 © ANSYS, Inc. 2009-02-09