For the flamelet model, you can display or write flamelet curves. Click the
Display Flamelets... or
Display Unsteady Flamelet... button. If you have a single flamelet, as for the unsteady flamelet model, you can access the
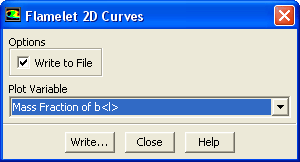
Flamelet 2D Curves dialog box (Figure
16.6.3).
Figure 16.6.3: The
Flamelet 2D curves Dialog Box
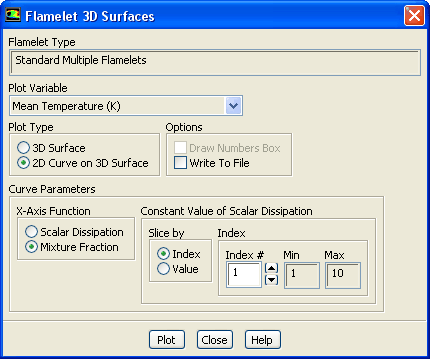
For the steady flamelet model with more than one flamelet, you can display 2D plots and 3D surfaces showing the variation of species fraction or temperature with the mean mixture fraction or scalar dissipation using the
Flamelet 3D Surfaces dialog box (e.g., Figure
16.6.4).
To access this dialog box, click the
Display Flamelets... button in the
Flamelet tab of the
Species Model dialog box, as shown in Figure
16.6.1.
Figure 16.6.4: The
Flamelet 3D Surfaces Dialog Box
To display the flamelet tables graphically, use the following procedure:
1.
In the
Flamelet 3D Surfaces dialog box, in the
Plot Variable drop-down list, you can select temperature or species fraction as the variable to be plotted.
2.
Specify the
Plot Type as either
3D Surface or
2D Curve on 3D Surface.
For a 3D surface, enable or disable
Draw Numbers Box under
Options. When this option is turned on, the display will include a wireframe box with the numerical limits in each coordinate direction.
For a 2D curve on a 3D surface:
(a)
Specify whether you want to write the plot data to a file by toggling
Write To File under
Options.
(b)
Specify the
X-Axis Function against which the plot variable will be displayed by selecting
Scalar Dissipation (
), or
Mixture Fraction (
). The variable that is not selected will be held constant.
(c)
Specify the type of discretization (i.e., how the flamelet data will be sliced) for the variable that is being held constant (under
Constant Value of Mixture Fraction or
Constant Value of Scalar Dissipation).
If you selected
Index under
Slice by, specify the discretization
Index of the variable that is being held constant. The range of integer values that you are allowed to choose from is displayed under
Min and
Max, and is equivalent to the number of points specified for that variable in the
Flamelet tab of the
Species Model dialog box (see Section
16.6).
If you selected
Value under
Slice by, specify the numerical
Value of the variable that is being held constant. The range of values that you can specify is displayed under
Min and
Max.
3.
Write or display the flamelet table results. If you have turned on the
Write To File option for a 2D plot, click
Write and specify a name for the file in the
Select File dialog box (see Section
2.1.6). Otherwise, click
Plot or
Display as appropriate to display a 2D plot or 3D surface in the graphics window.
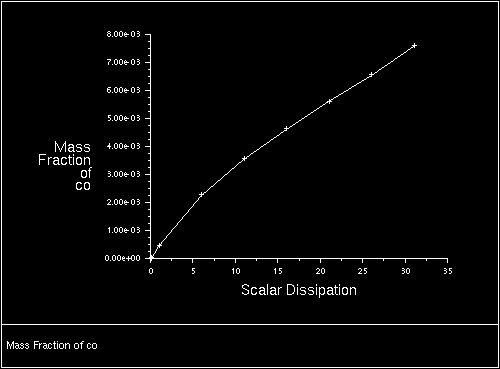
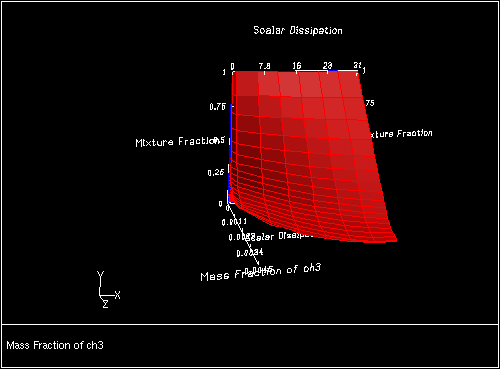
Figures
16.6.5 and
16.6.6 show examples of a 2D curve plot and 3D surface plot of a flamelet table.
![[ANSYS, Inc. Logo]](fluentlogo.gif)


 ), or
Mixture Fraction (
), or
Mixture Fraction (
 ). The variable that is not selected will be held constant.