- 1.
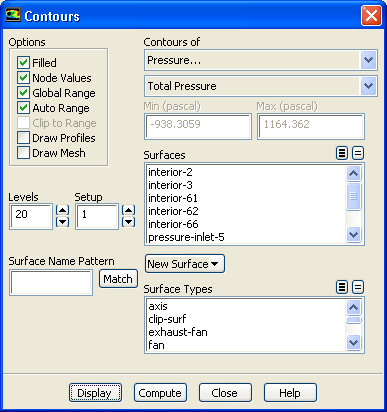
Display filled contours of total pressure (Figure
10.4).
 Graphics and Animations

 Contours
 Set Up...
- (a)
Enable
Filled in the
Options group box.
- (b)
Select
Pressure... and
Total Pressure from the
Contours of drop-down lists.
- (c)
Click
Display and close the
Contours dialog box (see Figure
10.4).
-
Total pressure contours show the expected pressure jump across the blower blades.
Figure 10.4: Contours of Total Pressure
 |
- 2.
Display velocity vectors (Figure
10.5).
 Graphics and Animations

 Vectors
 Set Up...
- (a)
Enter
5 for
Scale.
- (b)
Click
Display and close the
Vectors dialog box (see Figure
10.5).
Figure 10.5: Velocity Vectors
 |
-
By default,
Auto Scale is chosen. This will automatically scale the length of velocity vectors relative to the size of the smallest cell in the mesh. To increase the length of the "scaled'' vectors, set the
Scale factor to a value greater than
1.
- 3.
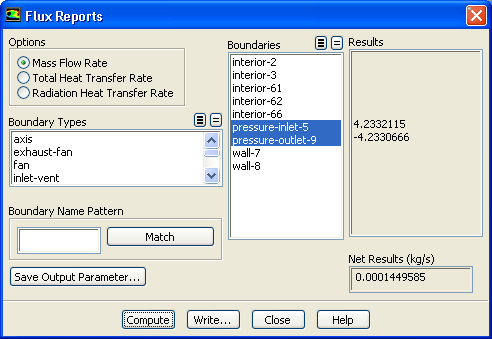
Report the mass flux
at
pressure-inlet-5 and
pressure-outlet-9.
 Reports

 Fluxes
 Set Up...
- (a)
Retain the selection of
Mass Flow Rate
in the
Options group box.
- (b)
Select
pressure-inlet-5 and
pressure-outlet-9 in the
Boundaries selection list.
- (c)
Click
Compute.
-
The net mass imbalance should be no more than a small fraction (say, 0.5%) of the total flux through the system. If a significant imbalance occurs, you should decrease your residual tolerances by at least an order of magnitude and continue iterating.
-
The flux report will compute fluxes only for boundary zones.
- (d)
Close the
Flux Reports dialog box.
-
Use the
Surface Integrals option to report fluxes on surfaces or planes.
 Reports

 Surface Integrals
 Set Up...


 Previous:
Step 7: Solution
Previous:
Step 7: Solution
Up:
Using Multiple Rotating Reference
Next:
Summary
Release 12.0 © ANSYS, Inc. 2009-02-09 ![[ANSYS, Inc. Logo]](fluentlogo.gif)