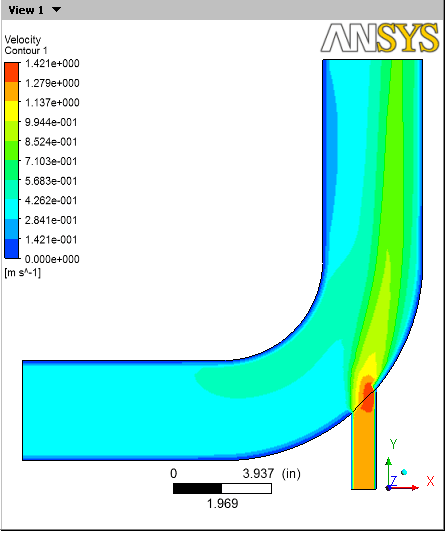
Create a contour plot of velocity on the symmetry plane:
- 1.
From the menu bar, select
Insert/Contour. In the
Insert Contour dialog box, accept the default name, and click
OK.
- 2.
In the
Details view for Contour 1, set the following:
|
Tab |
Setting |
Value |
|
Geometry |
Locations |
symmetry
 |
| |
Variable |
Velocity
 |
-
 Notice how the available locations are highlighted in the viewer as you move the mouse over the objects in the
Locations drop-down list. You could also create a slice plane at a location of your choice and define the contour to be at that location.
Notice how the available locations are highlighted in the viewer as you move the mouse over the objects in the
Locations drop-down list. You could also create a slice plane at a location of your choice and define the contour to be at that location.
 Velocity is just an example of a variable you can use.
- 3.
Click
Apply. The contour plot for velocity appears and a legend is automatically generated.
- 4.
The coloring of the contour plot may not correspond to the colors on the legend because the viewer has a light source enabled by default. There are several ways to correct this:
- You can change the orientation of the objects in the viewer.
- You can experiment with changing the position of the light source by holding down the
Ctrl key and dragging the cursor with the right mouse button.
- You can disable lighting for the contour plot. To disable lighting, click on the
Render tab and clear the check box beside
Lighting, then click
Apply.
Disabling the lighting is the method that provides you with the most flexibility, so change that setting now.
- 5.
Click on the Z on the triad to better orient the geometry (the
3D Viewer must be in viewing mode, not select mode, to do this).
Figure 1.5: Velocity on the Symmetry Plane
 |
- 6.
Improve the contrast between the contour regions:
- (a)
On the
Render tab, select
Show Contour Lines and click the plus sign to view more options.
- (b)
Select
Constant Coloring.
- (c)
Set
Color Mode to
User Specified and set
Line Color to black (if necessary, click on the bar beside
Line Color until black appears).
- (d)
Click
Apply.
Figure 1.6: Velocity on the Symmetry Plane (Enhanced Contrast)
 |
- 7.
Hide the contour plot by clearing the check box beside
User Locations and Plots / Contour 1 in the
Outline tree view.
-
You can also hide an object by right-clicking on its name in the
Outline tree view and selecting
Hide.


 Previous:
Step 7: Create an
Previous:
Step 7: Create an
Up:
Introduction to Using CFD-Post:
Next:
Step 9: Show Flow
Release 12.0 © ANSYS, Inc. 2009-03-30 ![[ANSYS, Inc. Logo]](fluentlogo.gif)

