For using Scalasca on CRESCO, users have to load the appropriate environment by typing in at the prompt the command scalasca-2.3.1. Detailed information can be found in the /doc directory as suggested by the command itself. Once loaded the Scalasca environment, a cursory look at the main features can be done by giving the command scalasca -h.
The basic steps in using Scalasca for analyzing a program involve three phases: program instrumentation, measurement execution and analysis report:
|
After successful execution of the job analysis a summary report file is created within a measurement directory called scorep_*. The summary analysis report can be postprocessed by typing the command:
|
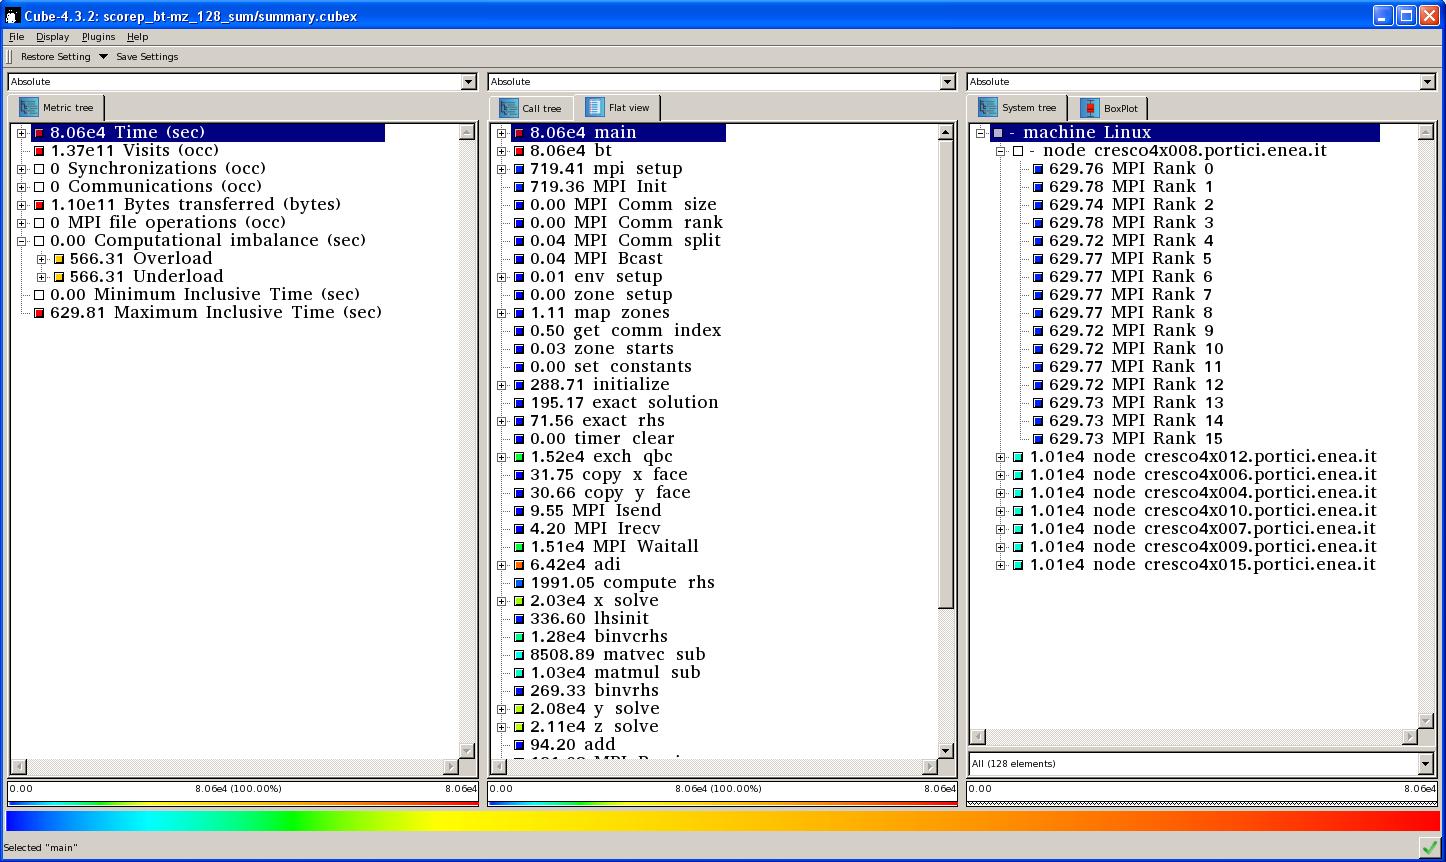
Scalasca comes with the GUI CUBE which allows the programmer to analyse the main metrics of the executable for eventually proceeding with further investigations.
|
|
It is possible to submit a Scalasca job to CRESCO in batch mode. This is accomplished by following the simple procedure described below.
Step 0: Optional
If the job will produce a huge amount of data or I/O, it should be better to use the ENEA GRID Parallel File System (GPFS).
cd ~/PFS/porq1_1M
mkdir myfolder
cd myfolder
Step 1: Load Scalasca
Load Scalasca environment by typing
scalasca-2.3.1
Step 2: Instrument the code
scorep mpicc myprog.c -o myprog
Step 3: Submit to LSF
Use a submition script from inside the Scalasca environment
bsub -o myoutput -e myerror -n #cores -q quename ./submit.sh
Where the script looks like:
#!/bin/sh
|
mpirun parameters.
Often it is necessary to put a double hyphen "--" before the target executable.
More details can be found in the Scalasca User Guide.
Also, it is recommended to read the OPEN_ISSUES file.